Simulacrum
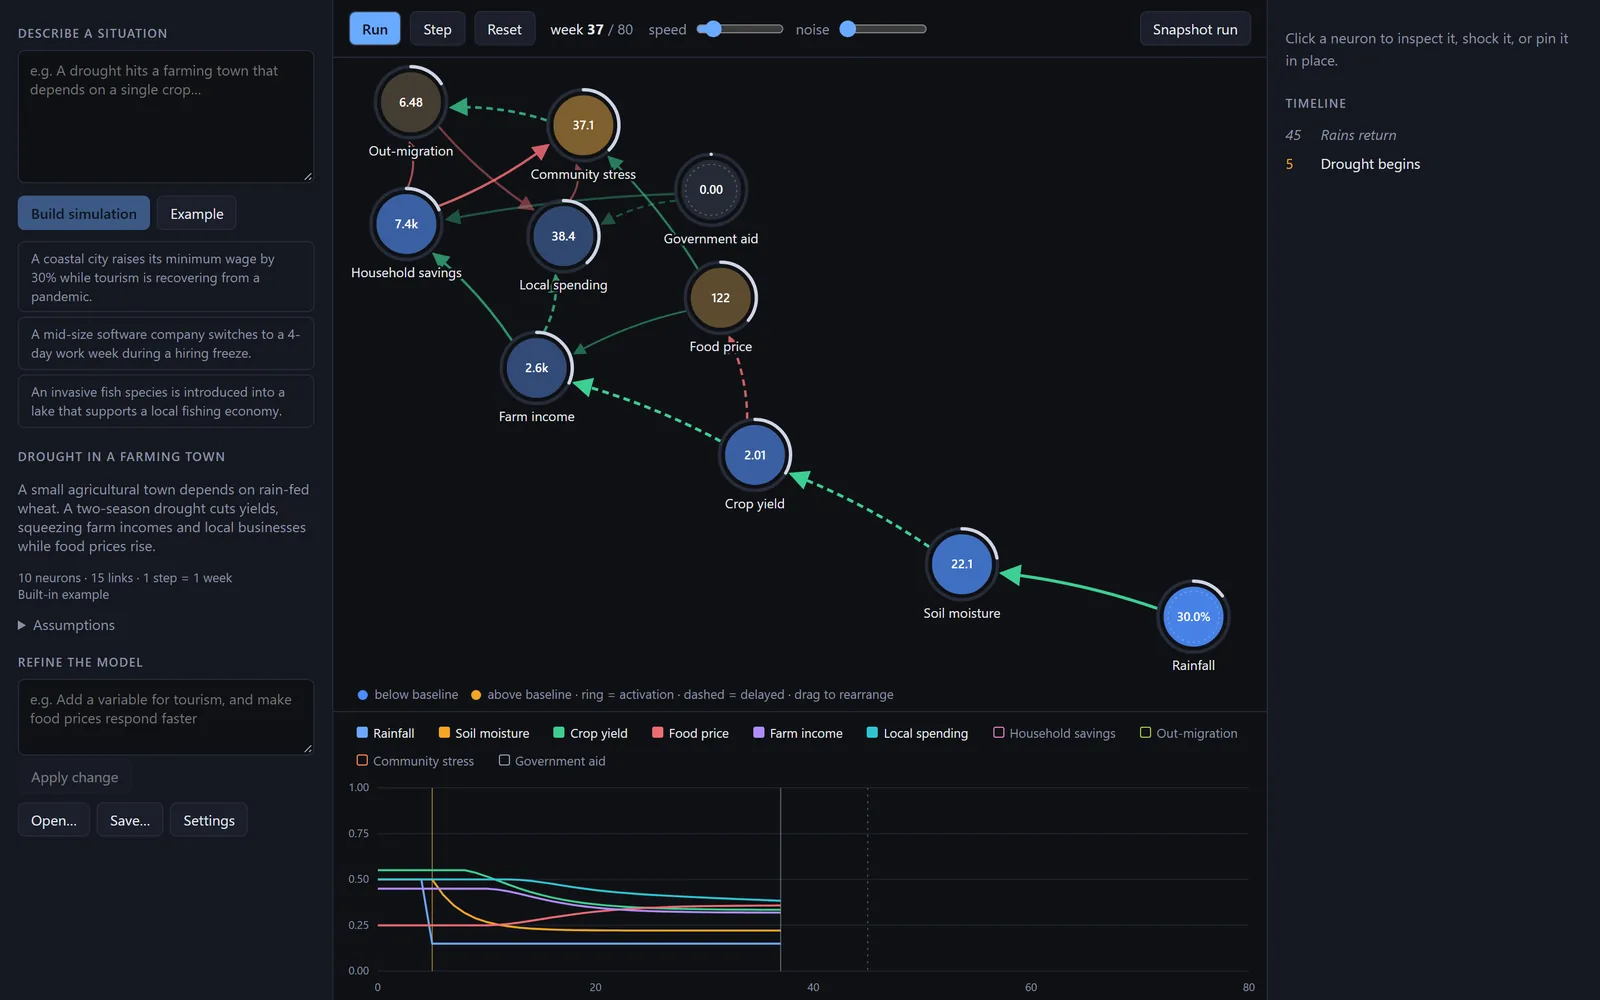
Describe a situation in plain text. Each variable becomes a neuron with weighted causal links, and you run the result as a sandbox.
- Type
- Desktop app
- Input
- A situation in plain text. Claude builds the model, and you can ask it for edits.
- Controls
- Run it forward, shock or pin any variable, and compare runs
- Testing
- Backtested against what happened, and scored against a forecast that nothing changes
- Status
- Private